I have written about several command-line tools provided with the Oracle and/or OpenJDK Java Development Kits (JDKs) in the past, but I've never written exclusively about the jstat tool. The Oracle JDK 9 Documentation Early Access states that jstat is used "to monitor Java Virtual Machine (JVM) statistics." There is also a warning, "This command is experimental and unsupported." Although I quoted the JDK 9 documentation, jstat has been a part of the Sun/Oracle JDK in some form (known at one time as jvmstat) in Java SE 8, Java SE 7, Java SE 6, and J2SE 5. Instrumentation for the HotSpot JVM was introduced with Java 1.4.1 (only enabled when -XX:+UsePerfData was set) and has provided "always-on instrumentation" since Java 1.4.2.
Much of the information that jstat provides can be gleaned from visual tools such as VisualVM, JMX and platform MBeans, garbage collection logs or via JVM options. However, jstat provides advantages when compared to each of these alternatives. Its advantages include those common to command-line tools such as the ability to execute from scripts and run without need of developers or others being present. It also is useful to be able to apply jstat to an already running Java process to start monitoring its JVM statistics rather than having the specify the monitoring of those options when starting the JVM.
For my examples in this post, I am using Oracle JDK 9 build 164. The next screen snapshot shows this version and also shows one of the first flags to apply when starting to use jstat: the -options flag.
As demonstrated in the screen snapshot, and as stated in the jstat documentation, jstat -options is used to "display the list of options for a particular platform installation." In my example being shown here, the following options are available:
-class-compiler-gc-gccapacity-gccause-gcmetacapacity-gcnew-gcnewcapacity-gcold-gcoldcapacity-gcutil-printcompilation
I'll only be looking at a small subset of these available options in this post, but the jstat documentation provides a single sentence describing each jstat option and the command-line use of each option is very similar to all other options. In fact, once one learns a few minor things regarding use of jstat, the execution of various options becomes the easy part. The difficult part of using jstat is often interpreting the data provided by jstat.
The jstat -help option prints a simple usage as shown in the next screen snapshot.
From the jstat usage message, we learn that the jstat command-line tool is executed by running the name of the command first (jstat) with the hyphenated option name next, followed by the optional -t and/or -h flags,
followed by a vimid, and concluding with an optional interval and optional count of the number of times to execute the command on the provided interval. Examples are clearer than descriptive text and some examples are shown in this post and in the jstat documentation.
For monitoring "local" JVM statistics, the vmid is simply the process ID of the JVM process. This is the same PID returned by the hip jcmd (or stodgy jps) for Java processes. The next screen snapshot demonstrates use of jcmd to identify the PID (8728 in this case) of the Java application I'm monitoring in my examples (JEdit in this case).
The "Virtual Machine Identifier" section of the jstat documentation provides significantly more details regarding the vmid because a more complicated vmid (for remote monitoring of JVM statistics) can include a protocol, the local targeted machine's vmid, host, and port. Although all of my examples in this post will use jstat and a simple Java PID (vmid), the jstat documentation does provide examples of use of a more detailed vmid for remote monitoring of JVM statistics.
For the remaining examples in this post, I wanted a Java application that was a bit more interesting from a JVM statistics monitoring perspective than JEdit is. I decided to use the "PigInThePython" sample application from Nikita Salnikov-Tarnovski's post "Garbage Collection: increasing the throughput" on the highly recommended Plumbr Blog. See that post if you're interested in seeing the source code for PigInThePython.
For my first example of using jstat, I use one of its most commonly used options: -gcutil. Besides demonstrating the -gcutil option, I'll use this first example to also demonstrate and explain the jstat output options that generally apply to other jstat options besides gcutil.
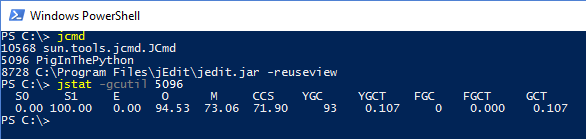
The following screen snapshot demonstrates use of jcmd to acquire the PID of the PigInThePython application (5096 in this case) and running of the simplest form of jstat -gcutil.
In its simplest form (with no other options), jstat -gcutil displays a single line of output with no timestamp. The column headings are described in the jstat documentation section "-gcutil option" which also describes the -gcutil option as, "Summary of garbage collection statistics." This documentation explains,
for example, that several of the columns indicate percentages of usage of different spaces' allocations while other columns indicate number of garbage collection events and total garbage collection time.
We often want to associate the statistics that jstat provides with the time that other events are occurring in the monitored system to identify correlations between those events and effects on the JVM. The jstat -t option will prepend a timestamp at the beginning of the output. This timestamp is the number of seconds since the JVM that is being monitored was started. Although this is not as convenient for humans to read as other formats, it does make it possible to correlate the JVM statistics with timeframes in which the JVM has been running and with garbage collection logs that had time stamps included. The next screen snapshot demonstrates -t in action:
It is typically useful to monitor JVM statistics such as those presented by jstat -gcutil more than once. The next screen snapshot demonstrates use of a specified interval (100 milliseconds intervals as specified with 100ms to have these results captured and shown every 100 milliseconds.
The output in the last screen snapshot never repeats the header with the column acronyms after showing it the first time. If one wants to have that header repeated after a certain number of lines to make it easier to know which numbers belong with which columns much farther down in the output, the -h option can be used to specify the number of results after which the column headers are displayed again. In the next screen snapshot, -h20 is used to see the header after every 20 rows.
There may be times when it's desirable to have jstat provide its data every so often and only for a certain number of times. The interval allows one to specify the duration of time between the results and any integer following that interval specification acts as the limit on the total number of times the results will be displayed. In the next screen snapshot, the 15 at the end of the command limits the output to 15 total rows.
The jstat -gccause option returns the same information as -gcutil, but also adds information about what caused the monitored garbage collections. The following screen snapshot demonstrates this.
In the above screen snapshot, we see that the "cause of last garbage collection" (LGCC) was "G1 Humongous Allocation" and that "cause of current garbage collection" (GCC) is "No GC" (there is no garbage collection currently underway).
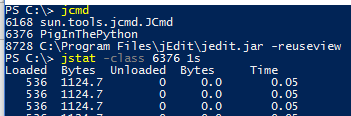
The next screen snapshot demonstrates use of jstat -class to see "Class loader statistics" number of classes loaded ("Loaded"), number of kilobytes loaded (first "Bytes"), number of classes unloaded ("Unloaded"), and number of kilobytes unloaded (second "Bytes"), and "time spent performing class loading and unloading operations" ("Time").
The command jstat -printcompilation indicates "Java HotSpot VM compiler method statistics" and is demonstrated in the next screen snapshot.
The -printcompilation option displays columns "Compiled" ("Number of compilation tasks performed by the most recently compiled method"), "Size" ("Number of bytes of byte code of the most recently compiled method"), "Type" ("Compilation type of the most recently compiled method"), and "Method" (name of class/method of most recently compiled method expressed in format consistent with HotSpot VM option -XX:+PrintCompilation).
The jstat -compiler command allows us to see "Java HotSpot VM Just-in-Time compiler statistics" such as number of compilation tasks performed ("Compiled"), number of failed compilation tasks ("Failed"), number of invalidated compilation tasks ("Invalid"), time spent on compilation ("Time"), type and class/method name of last failed compilation ("FailedType" and "FailedMethod"). This is demonstrated in the next screen snapshot.
There are several more options available with jstat and most of them are specific to different perspectives on garbage collection in the monitored JVM.
The jstat documentation warns that the tool is experimental and subject to change or removal in future versions of the JDK. The documentation also warns against writing scripts and tools that parse the output of jstat as the output content or format might change in the future. However, I can see how some might take the risk and write parsing code because this command-line tool is easily accessible from scripts and the parsing code needed would not be very complex.
This post has been an introduction to jstat, but there is much more to learn about the tool. Interpretation of the tool's results is more complex than using the tool and the analysis of the data provided by jstat is likely to be more challenging than the effort to collect the numbers. Several additional resources are listed below to provide more information on the collecting of and analyzing of Java Virtual Machine statistics with the jstat tool.
Additional jstat Resources