It is easiest to use the fdb command-line Flex debugger if the fdb application is in your platform's path. The
fdb.exe (for Windows) and fdb script (for Unix) are in the same bin subdirectory under the Flex SDK as are the Flex compiler (mxmlc.exe or mxmlc) and the ASDoc executables (asdoc.exe and asdoc). So, if you already have your path set up so that the Flex compiler is in it, the fdb debugger should already be in your path. If you don't have fdb in your path, you can always run it directly from the bin subdirectory in the Flex SDK installation.Most web users install the normal Flash Player because they do not need debug capabilities. However, to take advantage of Flash debugging capabilities, Flex developers will want to have the Flash Debug Player installed on their development browsers. The Flash Debug Player can be downloaded at http://www.adobe.com/support/flashplayer/downloads.html (look for "debugger versions"). Once the debug Flash Player is downloaded, install that on your favorite browser according to the download/installation instructions.
Assuming that you have
fdb in your path (or are willing to run it directly from the directory in which it resides) and you have installed a Flash debug player on your web browser, you can begin using fdb with the following steps:1. Compile the Flex Application with Debug Flag Turned On (true)
Compile your Flex code (MXML and ActionScript) with the mxmlc application compiler and be sure to set the option -debug=true. In the example I am using in this blog entry, this command is run as:
mxmlc -debug=true -strict=true DemonstrateFlexDebugger.mxmlThis is similar to compiling Java programs with its debug flag turned on. It allows the debugger to provide line numbers of errors and additional stack trace information just as the debug flag does for Java. Line numbers can also be included in stack traces when the mxmlc compiler option
-verbose-stacktraces is set to true, but setting -debug=true automatically sets this option to true.A snapshot of how running this Flex compiler looks is shown next (click on image to see larger version):

In this blog entry, I cover how to run the command-line Flex Debugger (fdb) that comes with the Flex SDK.
2. Run fdb in a Console/Terminal Window
To run the command-line debugger, simply run "fdb" if fdb is in your path as described above or else run "fdb" from the bin subdirectory in your Flex 2 SDK installation. You should see a couple lines of introductory information about the command-line debugger and a prompt
(fdb) that waits for your input. Typing "help" here (optional) will allow you to see the options you have with this debugger. For this blog entry, we'll go directly to the "run" command. Type run at the (fdb) prompt and you should see the message "Waiting for Player to connect."3. Run .swf File in Web Browser with Flash Debug Player
The fdb debugger won't do much for you if you don't run the Flash application you've just compiled (the .swf file compiled from your Flex code in Step #1) in a browser equipped with the Flash Player Debugger. In fact, I'll show in the debug example below that even some errant code does not produce any negative output when the special debug player is not installed. This makes a lot of sense because most of us don't want stack traces spewing out on clients' and customers' machines.
The easiest way to run the .swf file in the browser is to simply open that file in the browser and, assuming the Flash Player is properly installed on the browser, the browser will begin to render the Flash application. For a more realistic test, you could load any wrapper HTML file you have for your Flash application.
I stated the browser will "begin to render the Flash application" because you probably will only see a mostly blank page at this point. This is a hint that you need to move onto the next step.
4. Instruct fdb Command-line Debugger to 'continue' Twice
In Step #2, we ran "fdb" and then started fdb listening for an application to debug with the "run" command. Once we have loaded the .swf file into our browser, it will not be fully rendered because the fdb command-line debugger will be waiting for input from us to allow the application to proceed in loading. Specifically, the fdb debugger, which had said it was "Waiting for Player to connect," will not have recognized a Flash Player Debugger trying to run a Flash application. The fdb compiler will tell you that a Player has been connected and that a session has started. It will also explain that you can set breakpoints at this time and that you should enter 'continue' to proceed once you've entered desired breakpoints. For this example, we won't enter any breakpoints and will just type
continue. The fdb debugger will continue some additional file loading and instruct you to enter 'continue' again to proceed. We will not enter breakpoints now either and will simply enter continue to proceed.5. Watch fdb Output and React Appropriately
From this point on, because we did not enter any break points, the fdb command-line tool will display anything that we had in
trace() statements in our ActionScript code as that code is executed in the web browser. The only further interaction you would normally have with the fdb tool as this point is to start stepping through code once you hit a break point or if an error occurred. You need to enter continue whenever errors are flagged in fdb to move on in processing.There is obviously much more one can do with fdb and its help menu (mentioned earlier) provides many of these useful features and their keywords. Because this entry is already longer than I had planned, I am going to show only a very simple case here. I may revisit fdb in a future blog entry to cover some of its other goodies, but they are pretty easy to experiment with once the basics covered in this entry are understood.
For the code we will be processing in fdb, I have constructed a simple MXML file (DemonstrateFlexDebugger.mxml) and a simple ActionScript file (
SampleClass.as) that the MXML file imports. They are both shown next:DemonstrateFlexDebugger.mxml
<mx:Application xmlns:mx="http://www.adobe.com/2006/mxml"
                xmlns:flash.display="flash.display.*"
                width="500" height="300"
  applicationComplete="doSomeStuffToBeDebugged();">

  <mx:Script>
  <![CDATA[
  /**
   * To compile solely this Flex application from the command line, use
   *    mxmlc -debug=true -strict=true DemonstrateFlexDebugger.mxml
   *
   * This application provides code to be run through the Flex SDK debugger
   * (fdb).  The following steps must be followed to use fdb to debug this code.
   *
   * <ol>
   * <li>Compile (mxmlc) Flex application with -debug=true option.</li>
   * <li>Run fdb by typing "fdb" at the command prompt.</li>
   * <li>In terminal or console window in which "fdb" was run (last step), type
   * "run"</li>
   * <li>Run compiled Flex application (.swf file) in web browser with
   * Flash Debugger Player installed.</li>
   * <li>Type "continue" in fdb console window twice (can set breakpoints before
   * either continue</li>
   * </ol>
   *
   * Debugging information from the web browser running the Flex application
   * will display in the fdb window via trace() statements in the Flex code.
   * Execution in the fdb debugger window normally stops only for break points
   * or for certain types of errors that require "continue" for the fdb debugger
   * to continue on.
   * </ol>
   */

  import SampleClass;
  import mx.controls.Alert;

  /**
   * Provide some code to be debugged.
   */
  private function doSomeStuffToBeDebugged():void
  {
    trace("This is the doSomeStuffToBeDebugged() method!");
    const sample:SampleClass = new SampleClass();
    Alert.show(sample.getNullName());
    //const sample2:SampleClass = null;
    //Alert.show(sample2.getDataName());
  }
  ]]>
  </mx:Script>

  <mx:HBox id="mainBox">
    <mx:Label id="Notice"
              text="Run fdb and run this app in Flash Debugger Player" />
  </mx:HBox>

</mx:Application>
SampleClass.as
package
{
  /**
   * This class provides code to be exercised in the fdb debugger.
   */
  public class SampleClass
  {
    private const cName:String = "SampleClass";
    private var valuableData:String = "Valuable Data";
    private var dataName:String = "The Data with No Name";
    private var nullName:String = null;

    /**
     * Constructor.
     */
    public function SampleClass()
    {
      const mName:String = "SampleClass [constructor]";
      logMethodEntry( mName );
    }

    /**
     * Provide my valuable data.
     *
     * @return My valuable data.
     */
    public function getValuableData():String
    {
      const mName:String = "getValuableData()";
      logMethodEntry( mName );
      return valuableData;
    }

    /**
     * Provide my Data Name.
     *
     * @return My Data Name.
     */
    public function getDataName():String
    {
      const mName:String = "getDataName()";
      logMethodEntry( mName );
      return dataName;
    }

    /**
     * Provide my null name.
     *
     * @return My null name.
     */
    public function getNullName():String
    {
      const mName:String = "getNullName()";
      logMethodEntry( mName );
      return nullName;
    }

    /**
     * Log entry to the method whose name is passed in (aMethodName).
     *
     * @param aMethodName Name of method whose entry needs to be logged.
     */
    private function logMethodEntry(aMethodName:String):void
    {
      trace( "Entered method " + cName + "." + aMethodName + "." );
    }
  }
}
In the MXML code above, I intentionally defined a variable, sample2, of type SampleClass, but assigned it to null. This allowed me to have an issue that would be flagged by the debugger to demonstrate some interesting aspects of using fdb and the Flash Player Debugger.
Here is a summary of the steps to debug the application shown above:
1. Prerequisite: I set my path to include the bin directory of the Flex 2 SDK installation so that mxmlc and fdb were in the path.
2. Prerequisite: I downloaded the Flash Player 9 Debugger and installed that on my Firefox installation.
3. I compiled my simple example with the command:
mxmlc -debug=true -strict=true DemonstrateFlexDebugger.mxml - It was important to specify the -debug=true command. Note that I did not need to include SampleClass.as in the compilation because the Flex compiler knew to look for it and compile it because of its import inside of the MXML file. The output of running this compiler command was named the same as the input MXML file, but with a .swf extension -- in this case, DemonstrateFlexDebugger.swf.4. I started the command-line Flex 2 SDK debugger in a console with the command
fdb and then entered run at the (fdb) prompt.5. I opened DemonstrateFlexDebugger.swf in Firefox via its File->Open File option. The browser did not fully load the Flash application because it was waiting on the debugger to allow it to continue loading (see next step).
6. I entered
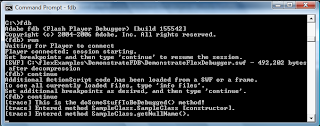
continue and then another continue in the command-line fdb tool and watched the rest of the output from my Flash application.At this point, with the highlighted lines in the code above still commented out, the debug process was finished. An example of how all of this looks in the console window in which fdb was run is shown next (click on image to make it larger). You can look for the
(fdb) prompts to see what I needed to enter (initial invoking of fdb executable followed by run and then continue and continue). You can also see the output from the trace() calls I included in my ActionScript code both in the MXML file and in the separate ActionScript class.
Ensure That All Steps of the Debugging Process Are Followed
I cannot overemphasize the importance of compiling with -debug=true, with having a Flash Player Debugger installed on your browser, and in running fdb to listen to debugger output from the debug-enabled Flash application running on the Debug Player. The rest of this entry covers what types of information you will miss during debugging if any one of these steps is left out.
To make things more interesting, I removed the comments from the two highlighted lines of code above so that they'd be executed. The main thing about these lines is that a variable is declared that is initialized to null and then the code tries to use that null object. This leads us to something of interest in terms of debugging.
Had I defined sample2 without assigning it to anything, the compiler would have warned me about an uninitialized variable. As coded above, however, with sample2 initialized to null, the compiler compiles completely successfully without errors or warnings. It is at runtime where this will bite us and that is where the debugger shines!
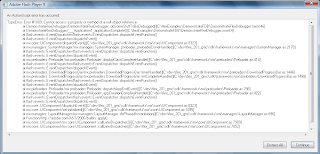
When I have complied (mxmlc) with
-debug=true and have executed the compiled .swf file on a browser with a Flash Player Debugger (with or without fdb running), I see the following output when trying to run the code against a null (click on image to enlarge it):
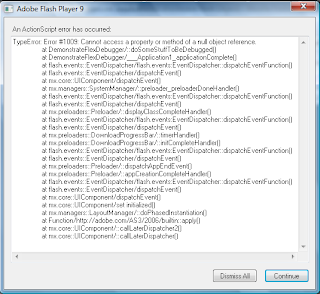
If I fail to compile my application with -debug=true, but I do have a Flash Player Debugger installed on my browser, I see the following output (click on image to enlarge):

The two examples above both displayed error messages to in my browser because the Flash Debug Player was installed. However, the example where the code was compiled with -debug=true is more informative and includes line numbers to help in the debug process. Note that neither example provided trace() statement output or in any other way gave me any idea of the values of different properties and variables during execution.
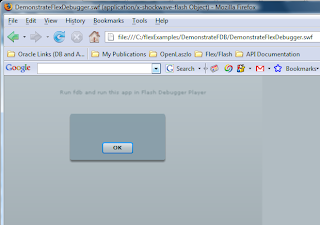
If I fail to install the Flash Player Debugger on my web browser, it doesn't matter how I compile my Flex application because I won't see any debug information at all. The next image shows this case. Note that there is no pop-up message warning of any problem. The application just doesn't work quite right (the troublesome code is seemingly ignored), but the user does not have to deal with a messy stack trace. This is good for an end user, but not very helpful for the developer.

In the three above examples, I did not really address whether fdb was being run in the console or not. Whether fdb is being run or not does not affect the output you see above for those three cases. If you don't have the Flash Player Debugger on your browser, you won't see any debug information regardless of whether or not fdb is running. In fact, the browser won't even try to communicate to fdb in that case. If you do have a Flash Player Debugger installed on your browser, you will still see the same output on the web browser shown above for when the -debug=true flag is set and for when it is not set. The only difference here is that the fdb debugger will report it first and require you to enter
continue and then the browser will pop-up the same windows you see above for the respective case.So why use the fdb debugger? The reason you would want to use the fdb debugging in association with code compiled with -debug=true and run on a Flash Debug Player is that fdb will provide you with much more detail than simply the errors. As shown above, fdb provides you with all trace() statement output and this is helpful for seeing flow of logic through your application before and after an error. Also, the fdb debugger allows you to step through lines of code one at a time and, as with most code debuggers, dump the values of properties and objects at any step along the way. While this was not shown here, it is often highly useful, especially for thorny runtime issues.
There is much more to fdb than covered here, but hopefully this entry provides an overview of how to use the command-line fdb debugger and how to use it with the mxmlc compiler and the Flash Debug Player.
This entry showed how to watch trace() output and other debugger output via the console window in which fdb is run. This output can alternatively be stored to a file as discussed in Logging Flash trace() Output to a File, in Flex Trace and Logging, and in Troubleshooting Tips for flashlog.txt Not Being Generated.
Another useful resource on Flex 2 Debugging is Using Flex 2 SDK Flash Debugger.
2 comments:
This post was very helpful. Thank you.
Keep it simple use debugFlex instead. No debug player required. trace code at run time: http://www.flashcomponents.net/component/debugflex.html
Post a Comment